

Managing Risk in Farm Decisions
A practical lesson on how yield and price uncertainty affect farm revenue, how risk-management tools address different exposures, and how to evaluate choices against a farm’s financial needs.
From Uncertainty to
How uncertainty affects revenue
Farm decisions are made before yields, selling prices, and input costs are known. concerns how much—or what quality—a farm will produce. Weather, pests, disease, and equipment or management problems can affect output. concerns the prices received for products and paid for inputs.
Revenue links yield and output price:
A farm can earn less revenue than expected because it produces less, receives a lower price, or faces both at once. Sometimes yield and price move in opposite directions: a widespread shortage may reduce production while raising market prices. That is not guaranteed, however, and an individual farm’s local yield may not follow the wider market.
| Scenario | Probability | Yield (bu/acre) | Price per bushel; revenue per acre |
|---|---|---|---|
| Typical year | 0.60 | 180 | $4.50; $810 |
| Lower yield | 0.25 | 130 | $5.20; $676 |
| Severe drought | 0.15 | 100 | $6.10; $610 |
Calculating and interpreting the average
First calculate revenue in each scenario by multiplying yield by price. For example, the typical-year revenue is per acre. The other outcomes are and per acre.
Then weight each revenue by its probability and add the results:
The probabilities sum to 1, so they account for all three listed outcomes. The result, $746.50 per acre, is a probability-weighted planning average—not a promise that revenue in a particular year will be near that amount. It also does not show how widely outcomes vary. Finally, it is not expected profit: production and marketing costs would need to be subtracted to estimate profit.
Matching Tools to Farm Risks
Choose tools for the exposure
Risk-management tools address different parts of a farm’s uncertainty; none removes every risk. A useful comparison asks what a tool can reduce, what risk remains, and what it costs or requires.
| Tool | Can help manage | Limitations and tradeoffs |
|---|---|---|
| Crop insurance | Covered production losses; some policies cover certain combinations of yield and price losses. | Terms, exclusions, deadlines, and payments depend on policy and location. Area-based payments may not match an individual farm. |
| Forward contract | Price uncertainty for a specified amount delivered at an agreed price or pricing formula. | Contracting more than the farm can deliver may create costly obligations if yields are short. |
| Sell futures | Some risk of falling output prices. | Local cash and futures prices may diverge (basis risk); margin requirements and market complexity matter. |
| Put option | Can establish a minimum futures-price level while preserving the ability to benefit if prices rise. | The premium is a cost; yield risk and all differences between local and futures prices remain. |
| Diversify | Dependence on one enterprise or weather event. | Works best when returns do not all respond alike to the same conditions. |
| Storage and flexible marketing | Can allow later sale; spreading sales can reduce reliance on one selling date. | Adds handling, storage, quality, interest, and price risks. |
| Reserves and flexible costs | Ability to withstand poor years and avoid forced sales. | Do not prevent production or price losses. Manageable debt, cash reserves, and flexible costs still matter. |
Consider how tools interact
A tool that reduces one exposure can leave another untouched. For example, selling futures can offset some risk of falling output prices, but it does not ensure that a farm will produce enough. A put option can set a minimum futures-price level while allowing the producer to benefit if prices rise, but it does not eliminate or all local-versus-futures price differences. Insurance may cover specified production or revenue losses, but its protection depends on the policy; an area-based payment can differ from the farm’s own experience.
Tools may also be combined. A farmer who forward-contracts part of expected production may use insurance to help manage the risk that actual production is too low to meet the contract. That combination does not make the contract obligation disappear, so expected production and policy terms matter. More broadly, the appropriate mix depends on cash flow and the farm’s ability to bear losses, as well as the costs and remaining risks of each strategy. Diversification is more useful when enterprises or locations do not all respond the same way to the same conditions; storage, meanwhile, creates its own costs and risks rather than guaranteeing a better sale price.
Choosing a Strategy That Fits
A structured decision process
A sound choice considers both expected return and risk. Start by deciding what the farm needs the strategy to accomplish; then test whether it can meet that goal under different conditions.
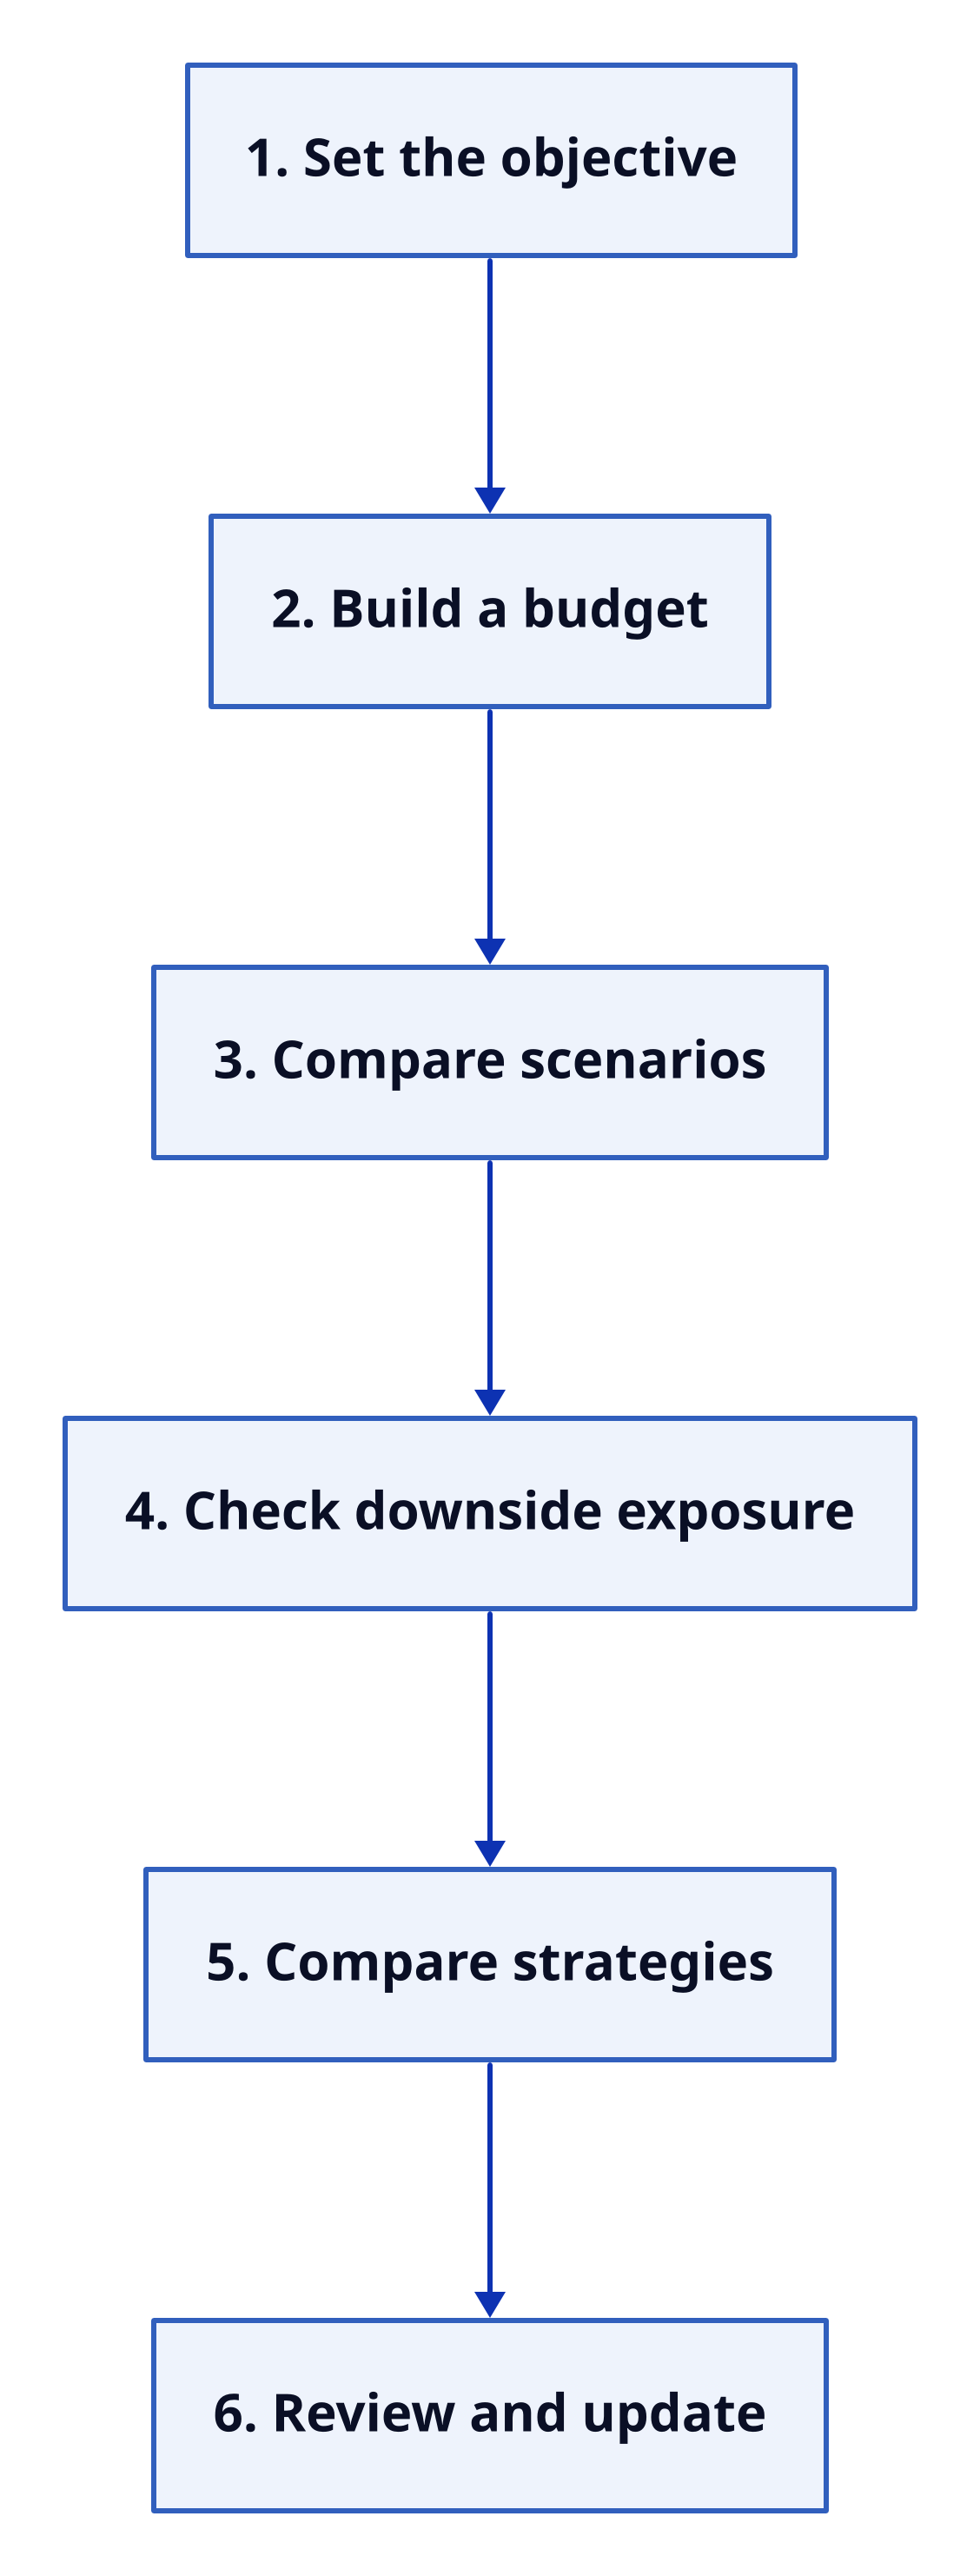
Text description
Decision-making under uncertainty A six-step sequence: set the objective; build a budget; compare scenarios; check downside exposure; compare strategies; review and update assumptions. Layout: down. 1. Set the objective 2. Build a budget 3. Compare scenarios 4. Check downside exposure 5. Compare strategies 6. Review and update 1. Set the objective → 2. Build a budget 2. Build a budget → 3. Compare scenarios 3. Compare scenarios → 4. Check downside exposure 4. Check downside exposure → 5. Compare strategies 5. Compare strategies → 6. Review and update
Apply the steps—and check fit
Set the objective. Decide whether the priority is maximizing expected profit, protecting cash flow, meeting debt payments, limiting the chance of a severe loss, or balancing several goals.
Build a budget. Estimate yield, output and input prices, variable and fixed costs, and financing needs, using realistic local information where possible.
Compare scenarios. Work through favorable, typical, and adverse combinations of yield, output price, and input cost. Include outcome probabilities when reasonable estimates are available.
Check downside exposure. Ask whether bills and debt obligations can be met in a poor scenario. The lowest likely cash balance, break-even price, and break-even yield can help make the exposure concrete.
Compare strategies. For each option, consider its cost, which risks it reduces, which risks remain, and how it affects expected returns. Include costs such as insurance and option premiums, storage costs, and contract commitments.
Review and update. Revisit assumptions as planting, weather, markets, costs, and the farm’s financial position change. Recording the reasoning and results can help improve future decisions.
The highest expected-return choice is not automatically the best choice for every farm. A producer with substantial debt or little cash reserve may prefer a lower average return if it comes with less chance of a loss that threatens the business. A farm with greater reserves may be able to accept more variability. and financial capacity therefore affect which strategy is suitable—but they supplement, rather than replace, careful comparison of costs, returns, and downside outcomes.
: Strategies for reducing the harmful effects of uncertainty while pursuing farm goals.
: The price at which revenue covers the relevant costs, or the yield at which it does so.