

Coordinating Forecasts, Pricing, and Capacity
A practical lesson on aligning demand forecasts, prices, capacity, and allocation through coordinated or iterative planning.
Plan Forecasts, Prices, and Capacity Together
Why the decisions belong together
A forecast is not just a prediction of how many customers may arrive. It should estimate demand by time period, customer group, and price or offer—and account for uncertainty. A forecast of 100 orders could mean demand is likely to be near 100, or that it could plausibly range from 60 to 150. Those cases have the same average but may call for different capacity reserves or booking limits.
Price changes demand, while capacity limits how much demand can be served. If capacity is scarce, using a slot for a lower-priced request may prevent serving a more valuable one later. The of that slot is the expected value of its best alternative use; a represents this marginal capacity value. Likewise, a lower price may fill otherwise idle capacity, but could also use capacity needed for later demand. So assess a price change by its effect on both expected contribution and capacity use, not revenue per sale alone.
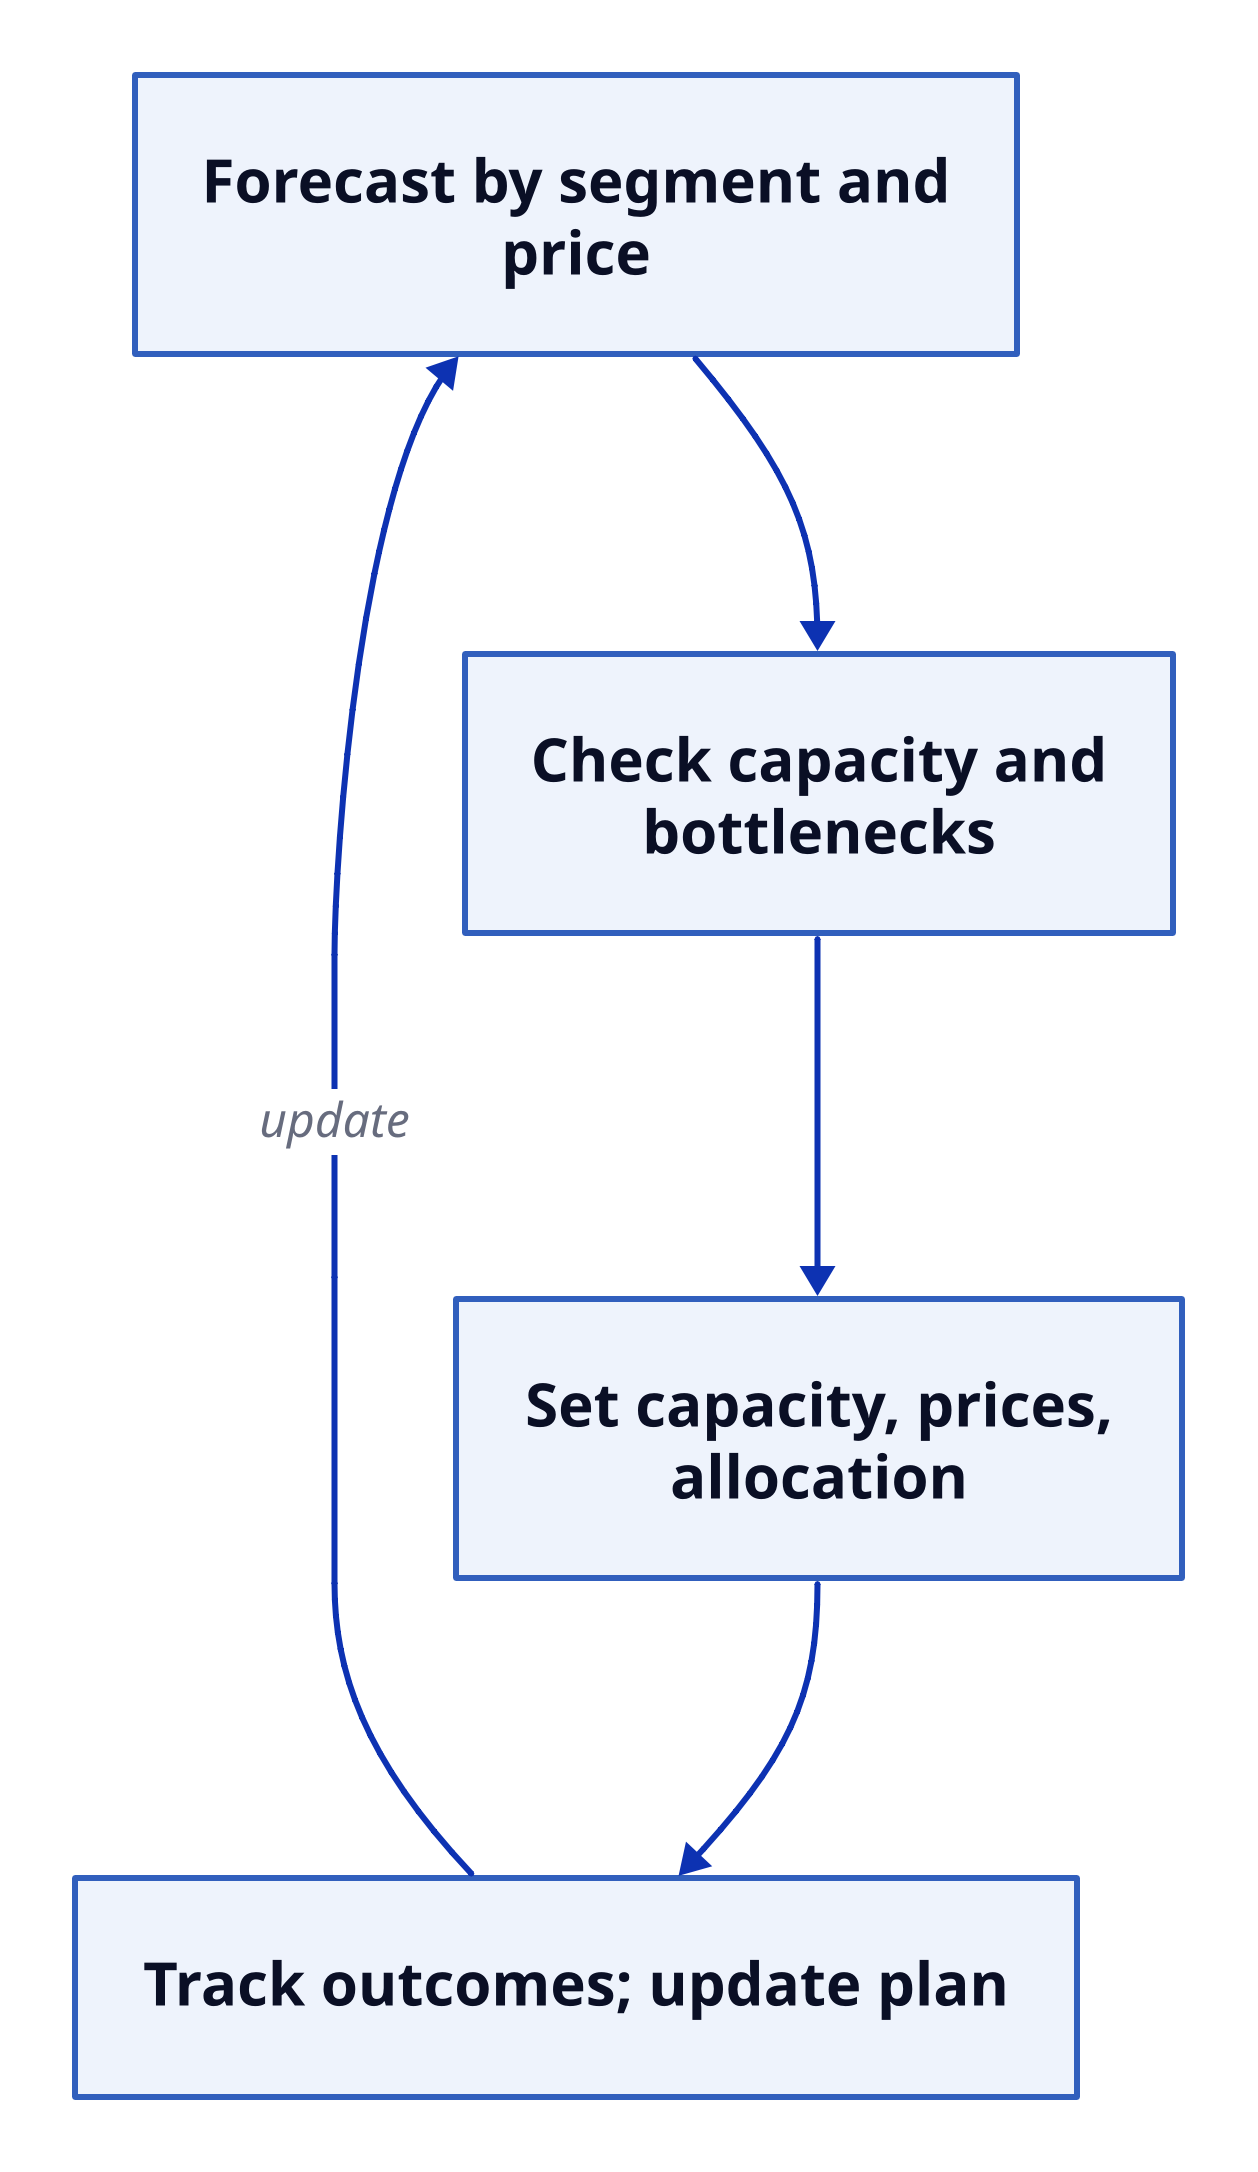
Text description
Coordinate and update Four process boxes form a loop. Forecast demand by period, customer group, and price or offer; compare the forecast with available capacity and identify bottlenecks; coordinate capacity, allocation rules, and prices; then track bookings, sales, prices, and capacity use and feed that information back into the forecast. Layout: down. Forecast by segment and price Check capacity and bottlenecks Set capacity, prices, allocation Track outcomes; update plan Forecast by segment and price → Check capacity and bottlenecks Check capacity and bottlenecks → Set capacity, prices, allocation Set capacity, prices, allocation → Track outcomes; update plan Track outcomes; update plan → Forecast by segment and price (update)
Integrated model or coordinated steps
A basic optimization model chooses prices and allocations to maximize expected profit: expected sales contribution minus capacity and operating costs and expected shortage or service penalties. It must represent how demand responds to prices, which shared resources products use, and when capacity is available. Planned use cannot exceed available capacity; when several resources constrain service, each needs its own limit. Adding capacity may capture lost demand, but its full incremental costs—such as investment, extra labor, overtime, or idle resources—and risks matter too.
A fully integrated model can be difficult to build or maintain. A practical alternative is a coordinated hierarchy: forecast demand under proposed prices; set prices using that forecast and the capacity outlook; then optimize allocation or booking limits using the resulting demand estimates. If allocation changes which demand can be served, revisit the pricing assumptions. A disciplined sequence can work when it accounts for demand risk; it is not a reason to treat the decisions as independent.
Example: 100 clinic slots
Suppose a clinic has 100 appointment slots next week, with routine and urgent visits competing for them. Filling every slot early with routine visits may leave no room for urgent patients who arrive later, or may require costly overtime. The clinic could reserve some slots and release them later if urgent demand does not materialize. The choice depends on forecast uncertainty, the cost of unused slots, the consequences of turning patients away, and whether extra staff can be added.
The forecast should estimate unconstrained demand: low routine bookings might reflect unavailable slots, not low interest. The clinic should also make its objective explicit. Maximizing revenue alone may conflict with access, clinical priority, or service goals, which should be represented as objectives or constraints.
Track forecast error, utilization, contribution per constrained resource, lost or deferred demand, and service performance. Record prices and availability alongside customer responses: when both change, sales alone may not show which change affected demand. Use this feedback to revise forecasts and decisions as conditions change.