

Evaluating Pollution-Reduction Policies
A guide to establishing whether pollution policies improve environmental outcomes, comparing their costs and benefits, and assessing how effects are distributed.
From Policy to Environmental Outcomes
Begin with the no-policy comparison
To judge whether a pollution-control policy caused improvement, first define a : the pollution and economic conditions expected without the policy. Compare observed outcomes with that . A simple before-and-after decline is not enough by itself, because other changes may have contributed to it.
Then trace the pathway the policy is meant to affect: a policy action—such as a standard, fee, subsidy, permit system, or investment—may change how pollution sources operate; those responses may change emissions, discharges, waste, or environmental concentrations; and those changes may affect health, ecosystems, recreation, or other outcomes. Evidence at one link does not automatically establish effects at every later link.
For example, an emissions inventory describes sources and quantities, while environmental monitoring measures pollution in the environment. Both can help assess a policy, but neither alone proves causation. Inventories can be incomplete or vary in quality, and may not capture how pollution travels. Ambient pollution can also be affected by weather, transport, and emissions from other sources.
Where possible, estimate the no-policy using comparison locations, phased implementation, before-and-after trends, or models. Account for other influences such as economic activity, weather, population, and concurrent policies. Clearly distinguish measured outcomes from modeled or estimated effects, and report uncertainty.
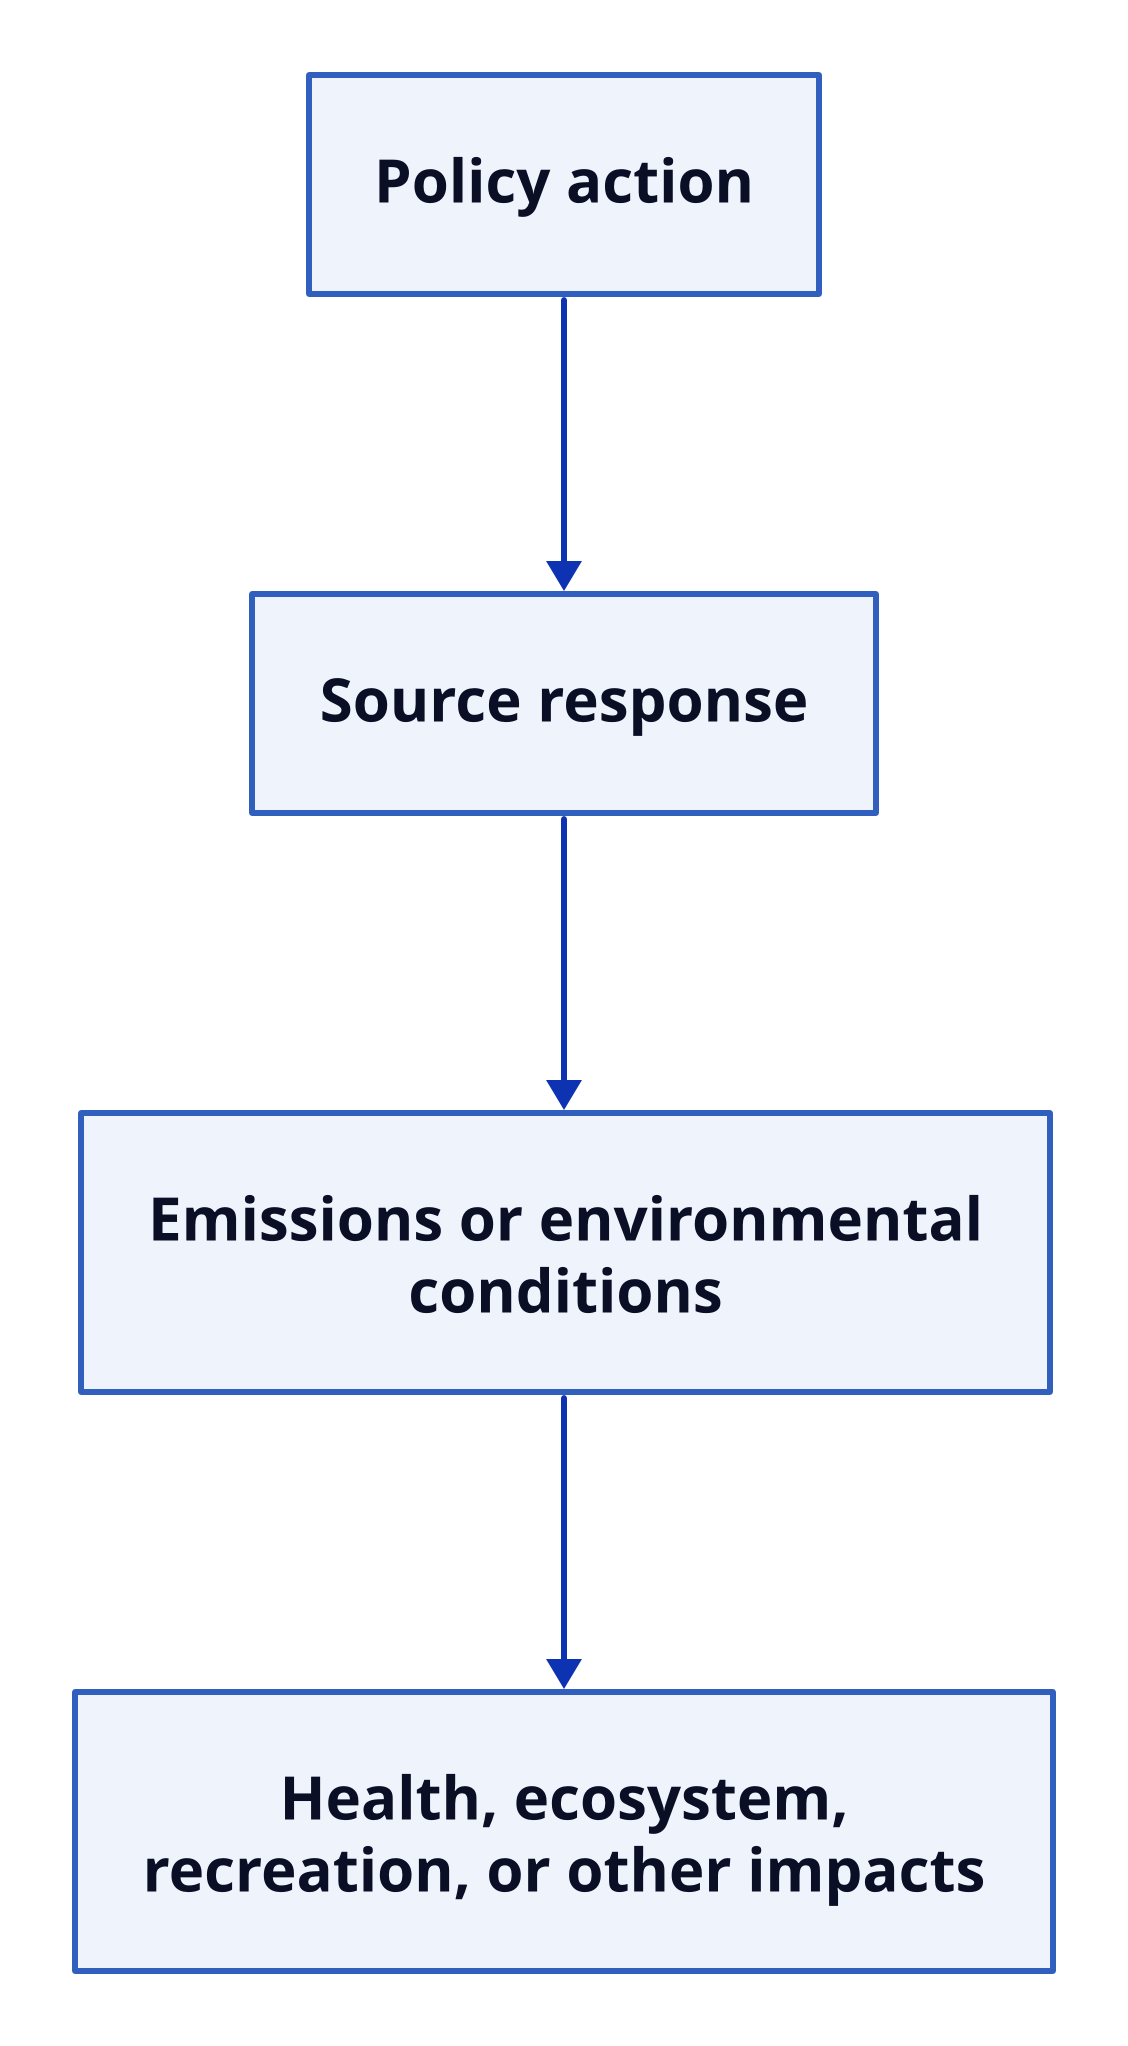
Text description
Trace the policy pathway Four nodes arranged from top to bottom: Policy action leads to Source response, then to Emissions or environmental conditions, then to Health, ecosystem, recreation, or other impacts. Layout: down. Policy action Source response Emissions or environmental conditions Health, ecosystem, recreation, or other impacts Policy action → Source response Source response → Emissions or environmental conditions Emissions or environmental conditions → Health, ecosystem, recreation, or other impacts
Read case studies with care
An assessment of the 1990 Clean Air Act amendments compared projected conditions with and without the amendments. It linked estimated emissions changes to modeled air-quality changes and then to health and other benefits. This illustrates why an evaluation should connect sources, environmental conditions, and impacts. It also shows a limitation: modeled air quality and a modeled no-policy scenario are estimates, not direct measurements of what would have happened otherwise.
For water, an upgrade can be assessed using facility discharge records and measurements upstream and downstream, alongside relevant costs and benefits. In one EPA case study, monitoring after the Boxelder Sanitation District treatment upgrade recorded reductions in nutrient levels, biological oxygen demand, selenium, and E. coli. These measurements show the value of checking environmental outcomes as well as facility performance. One project, however, cannot establish that every similar upgrade will produce the same results.
For waste, pay-as-you-throw programs charge households according to the amount of waste they set out, creating an incentive to reduce disposal or recycle. An EPA case description reports that Gainesville, Florida, adopted variable-rate residential pricing alongside recycling services. To assess such a program, compare waste collected, recycling, program and disposal costs, and possible side effects such as illegal dumping against a credible . A success story can suggest what to measure, but it is not by itself a controlled estimate of the program’s effect.
Comparing Costs and Benefits
Two analyses, two questions
asks: Which option achieves a specified pollution reduction at lower cost? A common measure is:
For instance, if two controls each reduce a pollutant by one ton per year, the control with the lower total cost is more cost-effective for achieving that reduction. The measure is useful for finding lower-cost ways to meet a goal, but it does not answer whether the goal’s benefits are worth its costs.
Hypothetical application: Suppose two options each reduce pollution by 100 tons per year. If their annualized costs are $120,000 and $160,000, their costs per ton reduced are $1,200 and $1,600, respectively. The first option is less costly per ton for this specified reduction. This comparison alone says nothing about whether the reduction’s overall benefits justify either cost.
Broaden the comparison to social benefits and costs
(BCA) asks whether estimated social benefits justify the costs. Benefits may include fewer pollution-related illnesses, improved ecosystems, and better recreation. Costs may include equipment, operation, monitoring, administration, and compliance. A BCA commonly reports net benefits—benefits minus costs—or a benefit-cost ratio.
Some outcomes are difficult to quantify or value. They should still be reported, rather than treated as if they were zero. BCA results also depend on assumptions, including the no-policy , valuation methods, the time horizon, and how future effects are discounted. So the result is not independent of the choices made in setting up the analysis.
Keep the distinction clear: cost-effectiveness compares the cost of meeting a specified reduction goal; compares estimated social benefits with costs. They answer different questions and are complementary, not interchangeable, tools.
Who Gains, Who Pays, and What Counts
Look beyond the aggregate total
A policy can have overall benefits greater than its costs while distributing those benefits and burdens unevenly. Ask which communities and industries receive pollution reductions, bear policy costs, or continue to face pollution risks. Aggregate totals alone cannot answer those questions.
A balanced judgment brings several kinds of evidence together: compare outcomes with a clearly explained no-policy ; distinguish measured data from modeled estimates; consider both cost per unit reduced and the broader value of benefits; and report uncertainty, , and outcomes that could not be monetized. State the assumptions that shape the comparison rather than presenting estimates as assumption-free facts.
No single indicator—whether emissions, spending, or a benefit-cost ratio—fully describes a policy’s performance. A strong conclusion explains what the evidence supports, who experiences the effects, and what remains uncertain or uncounted.