

Understanding Bond Yields and Yield Curves
A practical guide to bond yields, yield-curve construction and shapes, and careful interpretation of what curves can—and cannot—tell us.
Bond payments, yields, and prices
Coupon payments are not the same as yield
A bond is a loan to its issuer. Under the bond’s terms, the issuer typically makes scheduled coupon payments and repays the bond’s (or par value) at maturity, when the debt comes due.
The determines the scheduled interest payments relative to . For example, a $1,000 bond with a 4% annual coupon pays $40 each year: $1,000 × 0.04 = $40. That scheduled payment does not change just because the bond’s market price changes.
measures something different: the annualized return implied by the bond’s current price and promised payments, assuming it is held to maturity and payments are made as scheduled. Because YTM depends on the price paid as well as the payments received, it can change even when the coupon payment stays fixed.
Why prices and yields tend to move in opposite directions
Suppose market yields rise. An existing fixed-coupon bond’s scheduled payments have not increased, so it tends to look less attractive than bonds available at the new yields. Its price therefore tends to fall. Paying less for the same promised payments raises the return implied by that price—its YTM. When market yields fall, the reverse generally occurs: the existing bond’s price tends to rise and its YTM tends to fall. These are general tendencies, not fixed-size or guaranteed price movements.
The price relative to gives two useful terms: a bond selling above is at a premium, while one selling below is at a discount. Maturity also matters. Payments further in the future are discounted for longer, and longer-maturity bonds tend to be more sensitive to interest-rate changes than otherwise similar shorter-maturity bonds.
Building a
Build a snapshot from comparable bonds
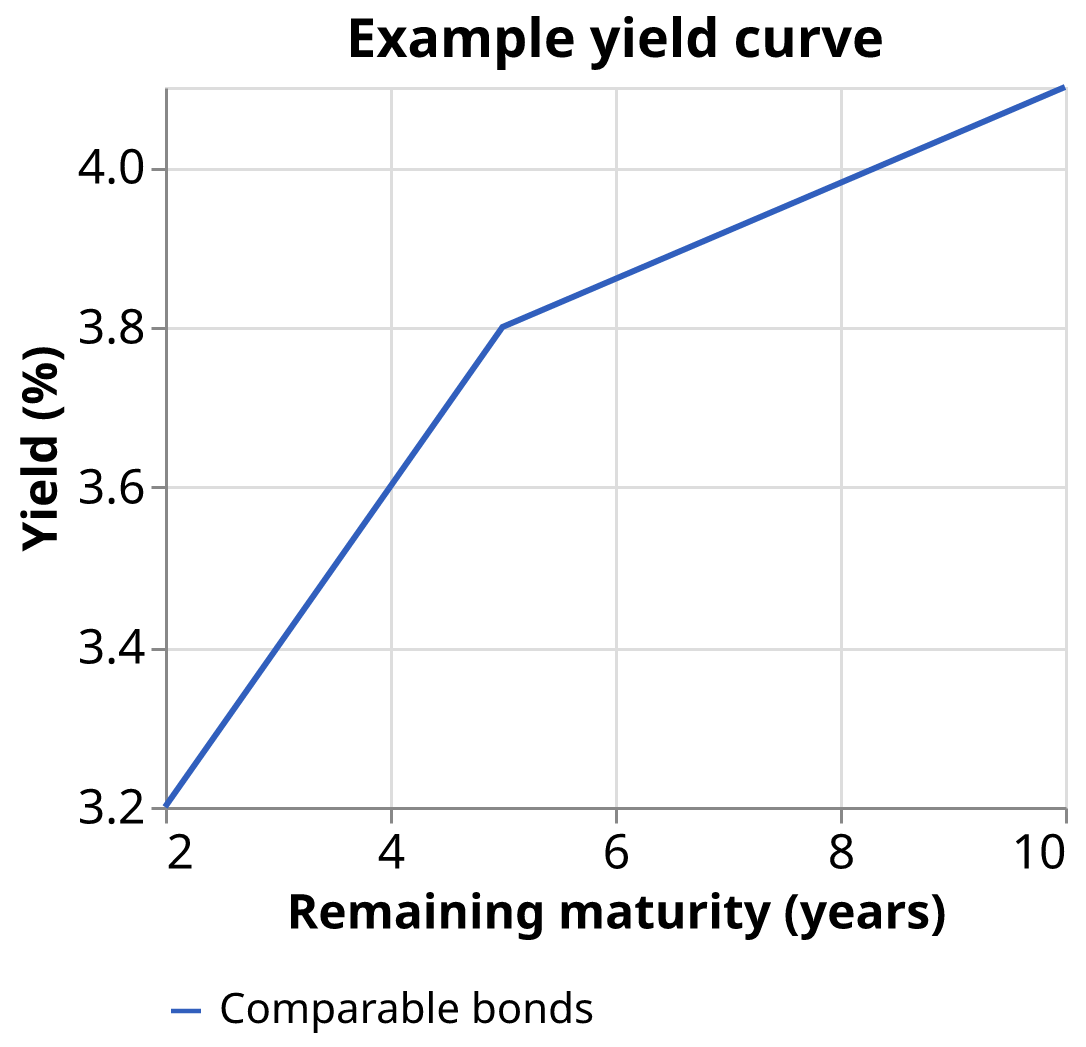
A plots yields against remaining maturities at a particular point in time. It summarizes borrowing costs across maturities for bonds with comparable credit quality and other characteristics.
To construct one, first select bonds comparable in issuer credit quality, currency, and tax treatment. Record each bond’s yield and remaining maturity. Put maturity on the horizontal axis and yield on the vertical axis, then connect or model the observations. The resulting curve is a snapshot: market conditions can change, changing bond prices and yields.
Text description
Example yield curve A line chart with remaining maturity in years on the horizontal axis and yield in percent on the vertical axis. Three points are connected: 2 years at 3.2%, 5 years at 3.8%, and 10 years at 4.1%. Comparable bonds (Remaining maturity (years); Yield (%)): 2; 3.2 5; 3.8 10; 4.1
In the supplied example, yields are 3.2% at 2 years, 3.8% at 5 years, and 4.1% at 10 years. Plotting each maturity-yield pair shows an upward slope over that range. This compares yields across different maturities at one point in time; it does not mean that an individual bond’s yield will follow the curve as time passes.
Curves can be produced in different ways. Some use yields on bonds trading in the market; others estimate yields from bond prices. Published U.S. Treasury constant-maturity yields are estimated rates for standardized maturities, not necessarily the yields of individual Treasury securities that mature on those exact dates. A Treasury reports yields for hypothetical securities that would trade at . Other methods estimate zero-coupon (spot) rates for individual payment dates.
Reading curve shapes and changes
Recognize the curve’s shape
A curve’s shape describes how yields compare across maturities. The table summarizes common patterns and possible interpretations. These explanations are possibilities, not certain forecasts.
| Shape | Yield pattern | Possible interpretation |
|---|---|---|
| Upward-sloping (normal) | Longer-maturity yields are higher. | May reflect compensation for longer lending, expectations about future short-term rates, or both. |
| Flat | Short- and long-maturity yields are similar. | May occur during a transition in expectations; meaning depends on surrounding conditions. |
| Inverted (downward-sloping) | Shorter-maturity yields are higher. | May reflect expectations that future short-term rates will fall. Inversions have often preceded recessions, but do not guarantee one or establish its timing. |
| Humped | Intermediate-maturity yields are higher than yields at both ends. | May reflect different expectations or risk premiums across maturities. |
An may occur when investors expect future short-term rates to fall—for example, if they anticipate weaker economic activity or lower inflation. Although inversions have often preceded recessions, they do not guarantee a recession or say when one will occur. More generally, a curve’s shape can reflect different expectations or risk premiums; it does not establish an economic outcome with certainty.
Track changes in the gap
A curve steepens when the yield gap between longer and shorter maturities widens. It flattens when that gap narrows. The change can come from the long end, the short end, or both.
Hypothetical application: Suppose a longer-maturity yield is initially 4.0% and a shorter-maturity yield is 3.0%. The gap is 1.0 percentage point. Later, if the longer yield is 4.2% and the shorter yield is 2.4%, the gap is 1.8 percentage points, so the curve has steepened. A widening gap can also occur if only long-term yields rise, only short-term yields fall, or both move in those directions.
Interpreting curves with care
Use a curve as a comparison, not a certainty
A helps compare borrowing costs at different maturities and observe how market pricing changes over time. Its shape reflects several influences, including expectations about future short-term interest rates and the compensation investors require for holding longer-term bonds. So a long-term yield is not a pure forecast of future short-term rates, and a curve cannot guarantee an economic outcome.
Make comparisons carefully. A Treasury curve and a corporate-bond curve may differ because corporate bonds also carry credit and liquidity risks, in addition to interest-rate and maturity effects. Compare like with like, and identify the date, securities, yield measure, and being considered.
One familiar spread is the 10-year Treasury yield minus the 2-year Treasury yield. A negative result means the 10-year yield is below the 2-year yield. Hypothetical application: if the 10-year yield is 3.7% and the 2-year yield is 4.1%, then the spread is 3.7% − 4.1% = −0.4 percentage points. The negative sign describes that yield comparison; by itself, it does not make the curve a certain forecast.
: An estimated yield for a standardized maturity.
: A rate for a single payment date, estimated using a zero-coupon bond approach.
: A curve where longer-maturity yields are higher than shorter-maturity yields.
: A widening of the yield gap between longer and shorter maturities; flattening is a narrowing of that gap.